Genel Özellikler
Integrated network management software for today’s networks!
Managing network performance is always a great challenge. This doubles when multiple point-products are used to manage it. Introducing OpManager v12.1, world's first truly integrated network management software for faster and smarter network management. It out-of-the-box offers network monitoring , physical and virtual server monitoring, flow-based bandwidth analysis, firewall log analysis and archiving, configuration and change management, and IP address and switch port management, thereby providing all the visibility and control that you need over your network.
Network Performance MonitoringIn today's world, IT administrators have to troubleshoot and fix a problem even before it starts affecting the end user. OpManager lets you monitor all your devices for availability, performance, traffic, and other parameters, so you can monitor the issues proactively and prevent problems from happening. Here are some common network issues and how OpManager helps you with them.
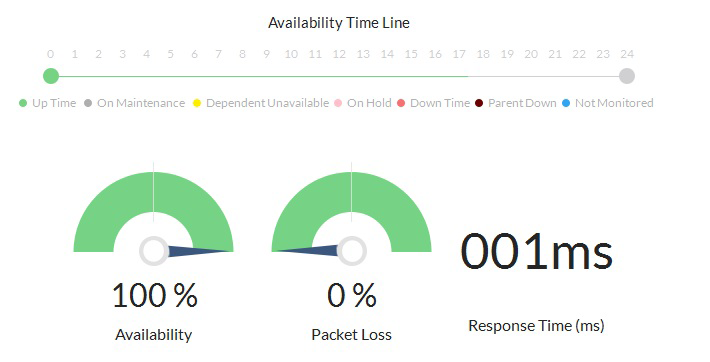
AvailabilityWhen every minute of downtime can cost you thousands, if not millions of dollars, maintaining 100% uptime all the time is a necessity. OpManager will ping the monitored devices at the defined monitoring intervals, and if any device is down or if the response time or packet loss is huge, OpManager will notify you immediately by sending an e-mail or a text message.
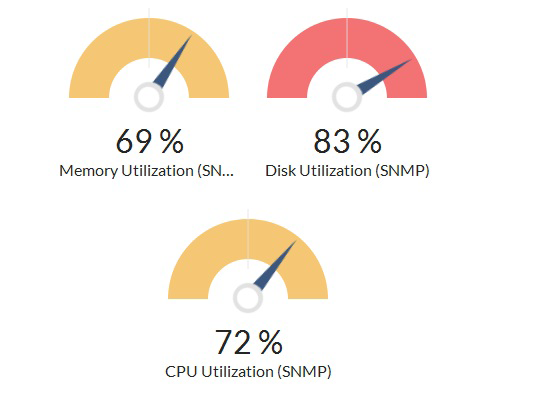
High CPU or memory usage on a physical server, virtual machine or network device can considerably affect the performance of the devices, which may in turn affect the end user. OpManager lets you monitor devices using SNMP, WMI, Telnet, SSH, VMware native API. And if the monitored value exceeds the defined threshold limit, OpManager will notify you through e-mail or text message, so you can quickly troubleshoot the problem.
You can define your threshold as shown below and receive alerts when there is a problem.
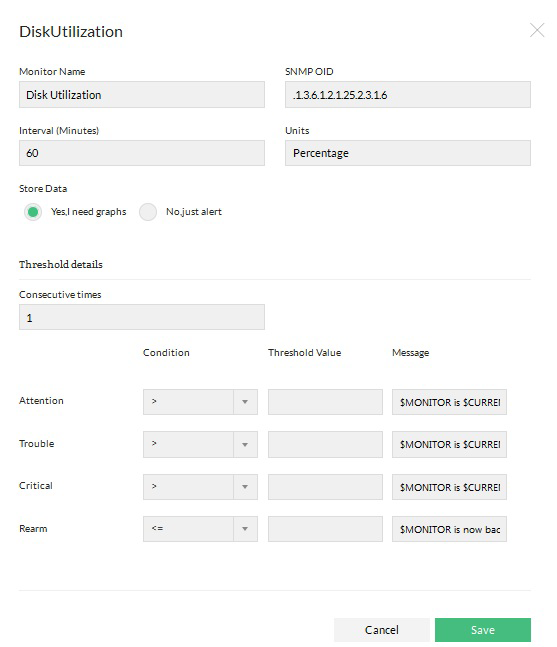
The last thing you want in the middle of the night after a day's work is user calling to tell you an application is down because the drive is full. OpManager can monitor the drive and raise an alert when it crosses the defined threshold limit.
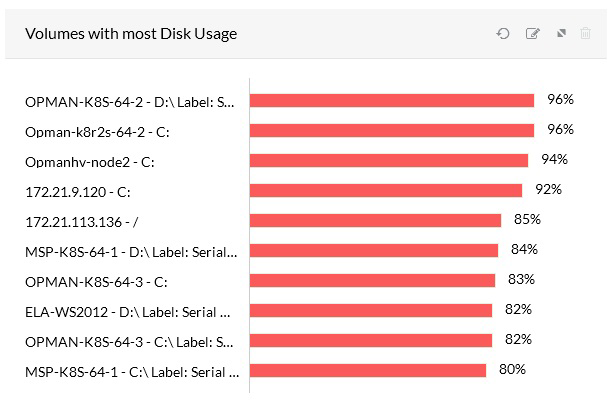
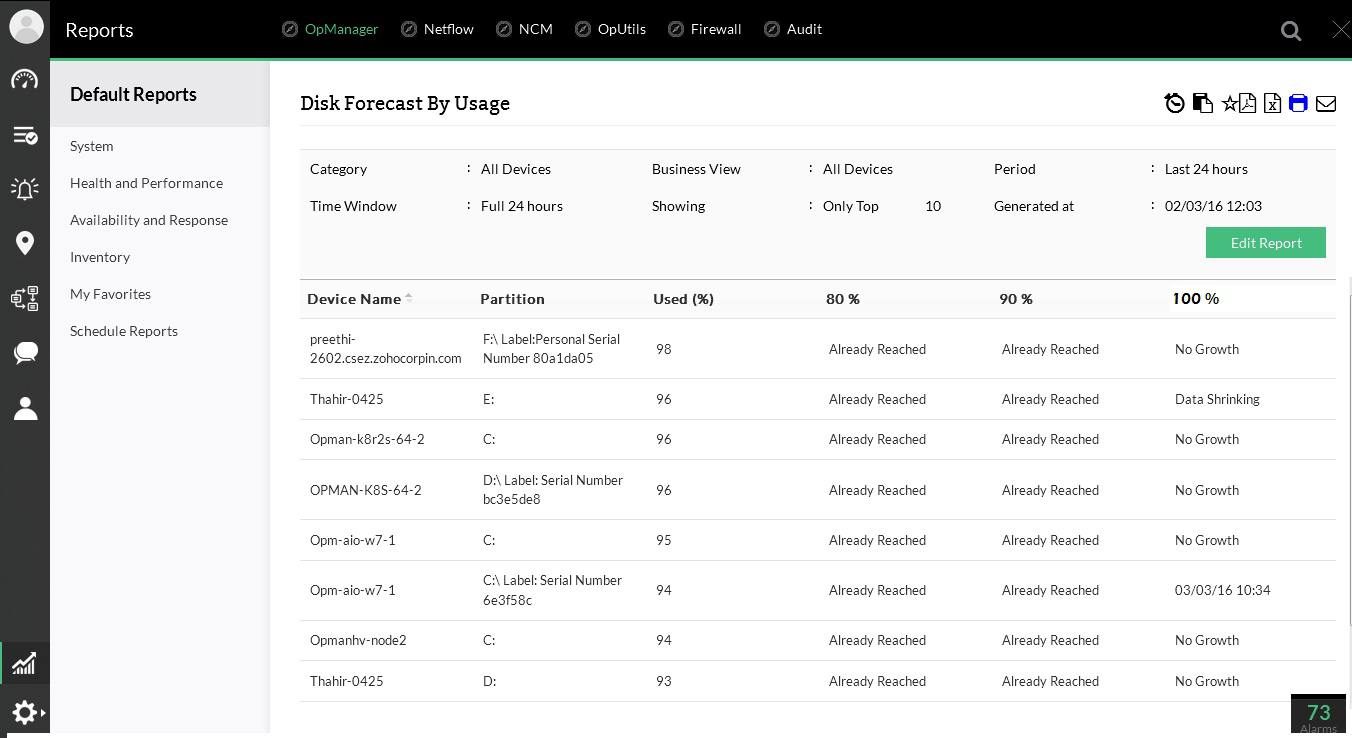
Apart from this, OpManager can also forecast when the drive will be full. This helps you with capacity planning.
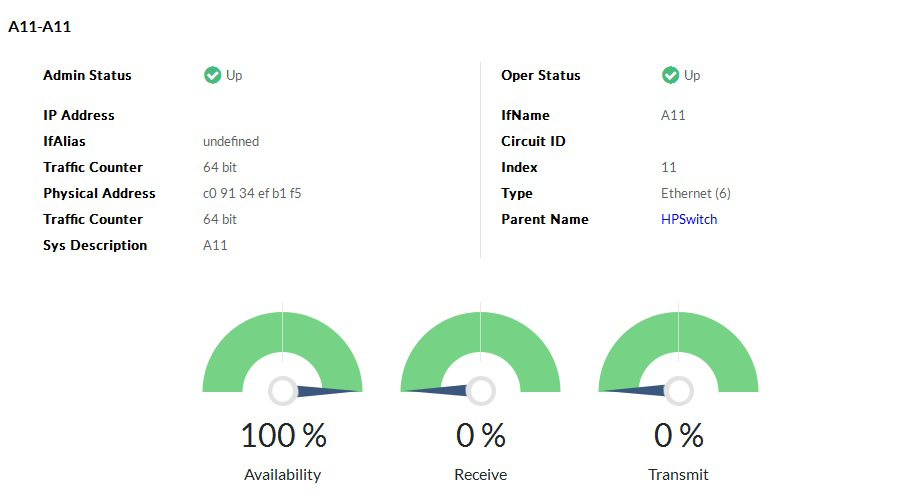
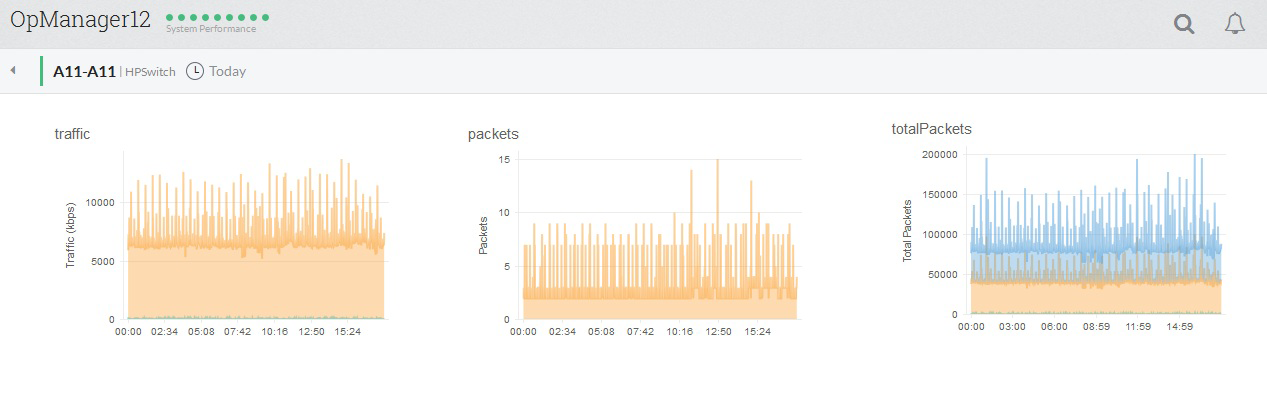
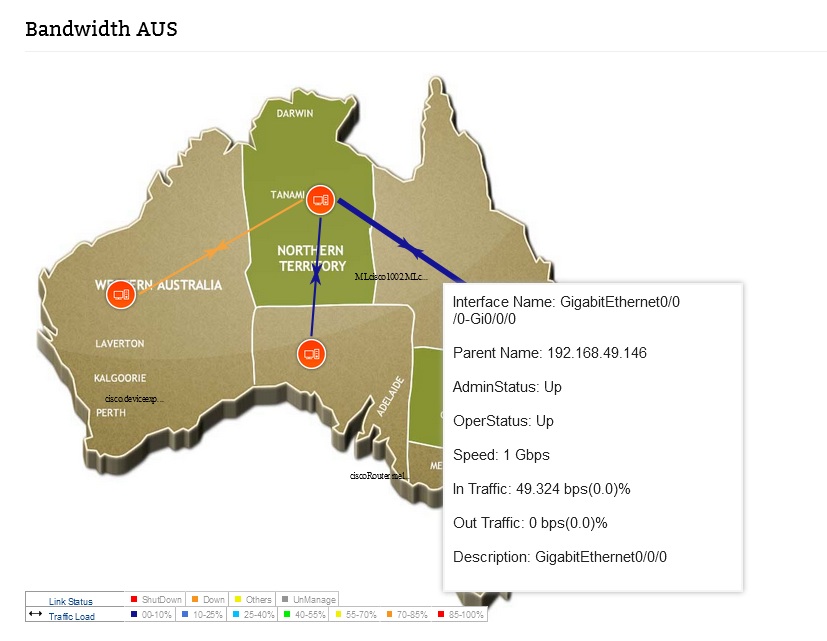
Monitoring interface availability and bandwidth is as important as monitoring the device itself. If the port is down or if traffic flow is high, the performance of the application and the end user experience can be adversely affected. OpManager monitors availability, traffic, errors, and discards of the interface and immediately alerts you when the threshold limit is violated, so you can immediately rectify the problem.
Prioritizing the traffic for business critical applications isas important as monitoring the traffic itself. A small mistake on the QoS setting might make you deal with an angry end user. Now, you can visualize which application uses the traffic using our NetFlow add-on.
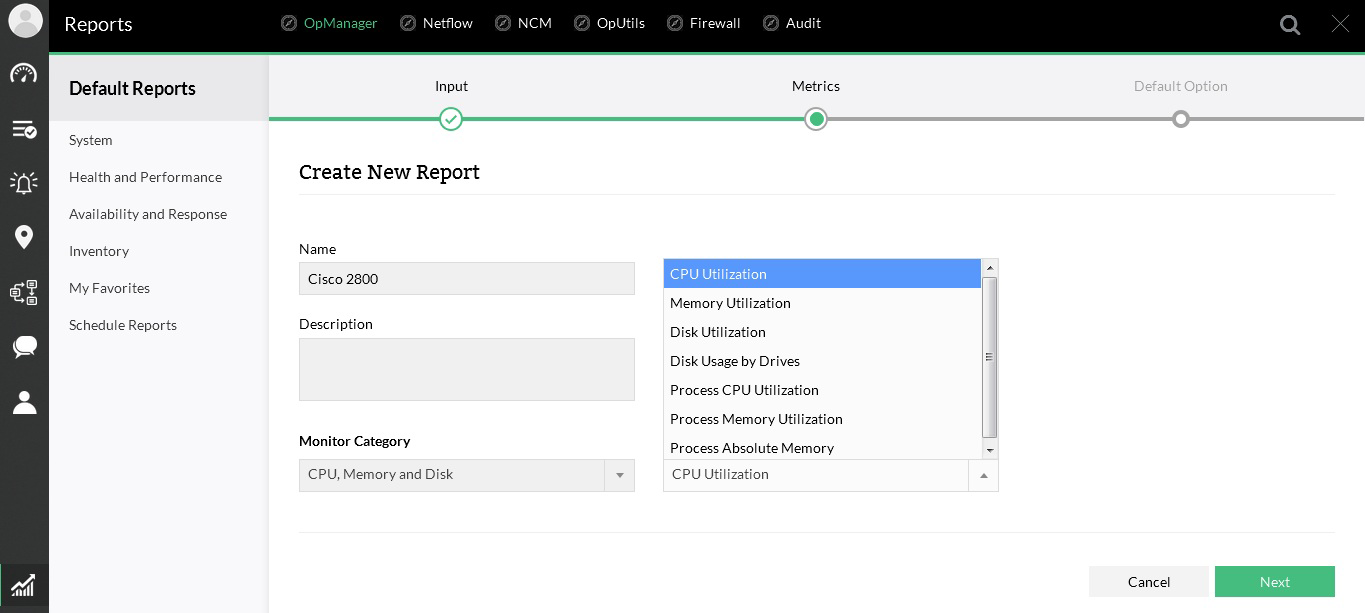
Apart from the standard monitors we saw in previous slides, we have support for most of the commonly used devices in the market. Here is an example of some common monitors for Cisco 2800 series:
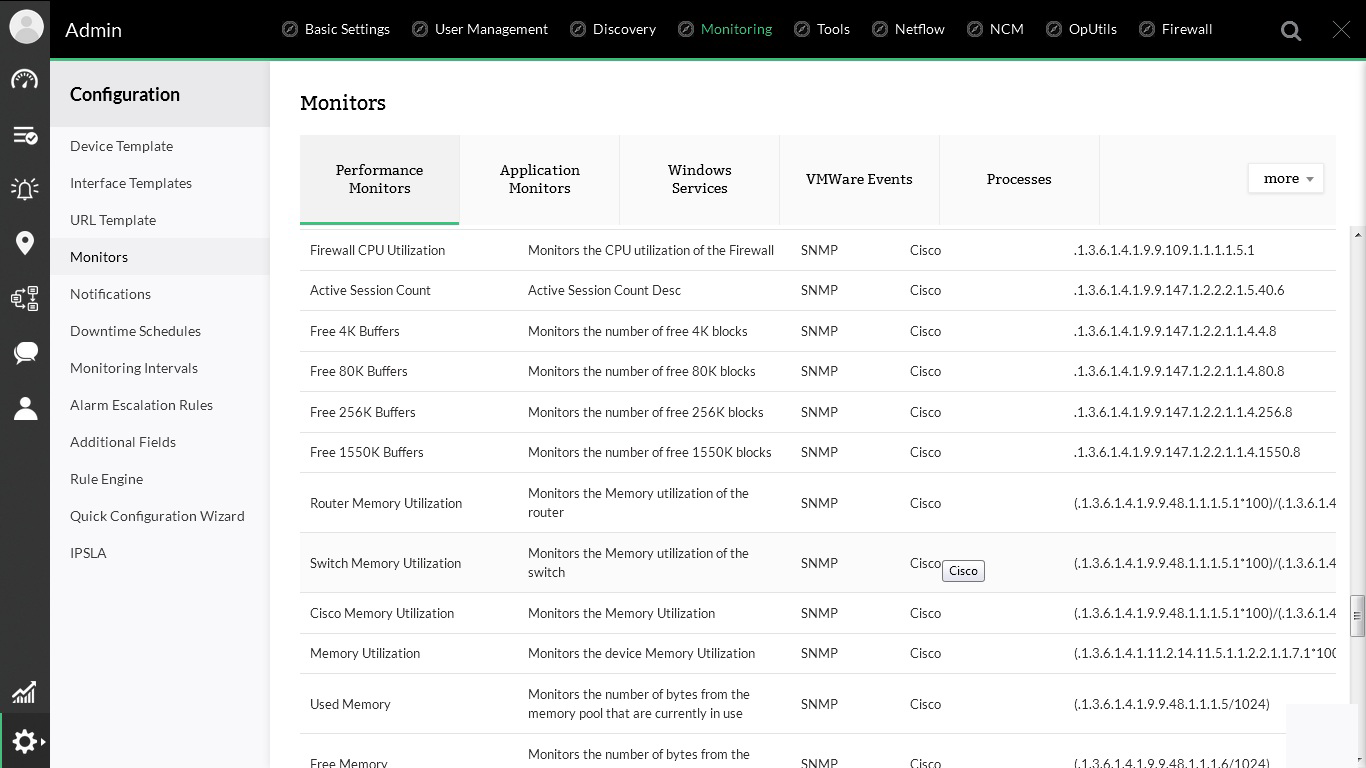
If the performance counter you are looking to monitor is not available, you can always get the SNMP MIBs from the vendor and create custom SNMP monitors or load the WMI classes from the device and create a monitor.
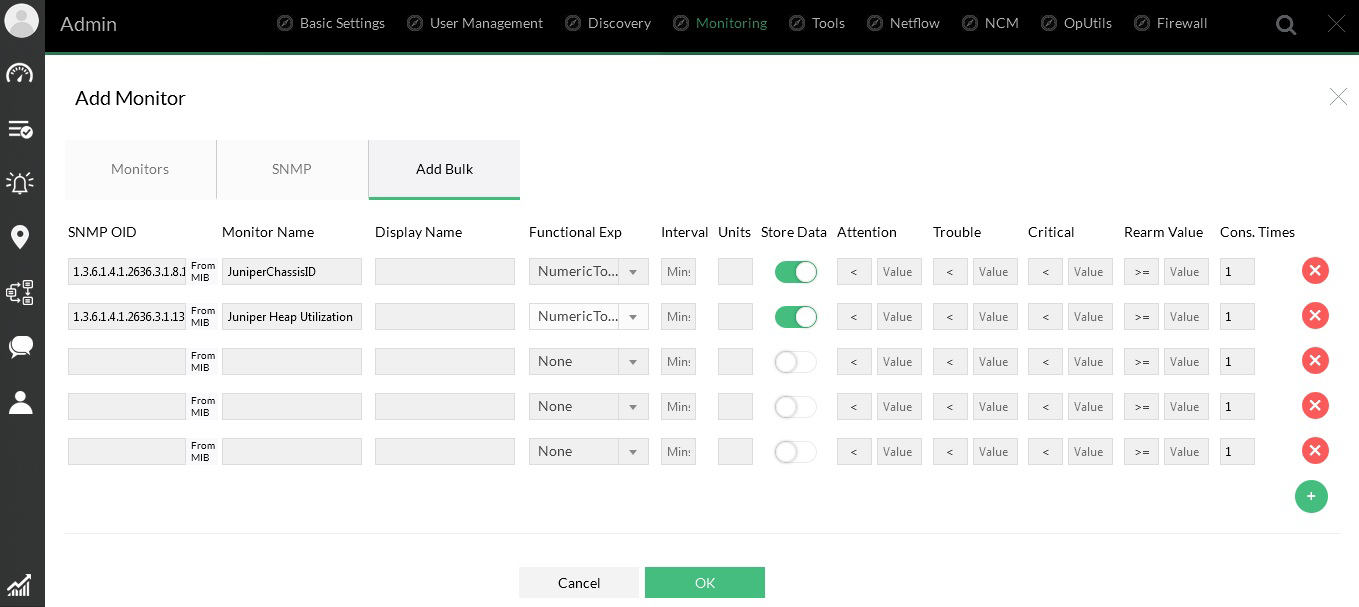
Apart from this, you can monitor the following resources: TCP ports for availability and response time; Windows services for availability; processes for availability, CPU, and memory; files and folders for availability, size, and age; Windows event logs; and syslogs from Linux and network devices.
If you are using scripts to extract certain values from servers, you can use the same values in our script monitor and monitor them. You can also get alerts based on the thresholds set and generate the reports based on the monitored value.
Dashboards and VisualizationOpManager provides customizable dashboards and various visualization options, which you can customize to suit everyone from Sysadmins to NOC screens to CEO's. Each user has the option to choose different widgets and customize the dashboard based on his or her interest.
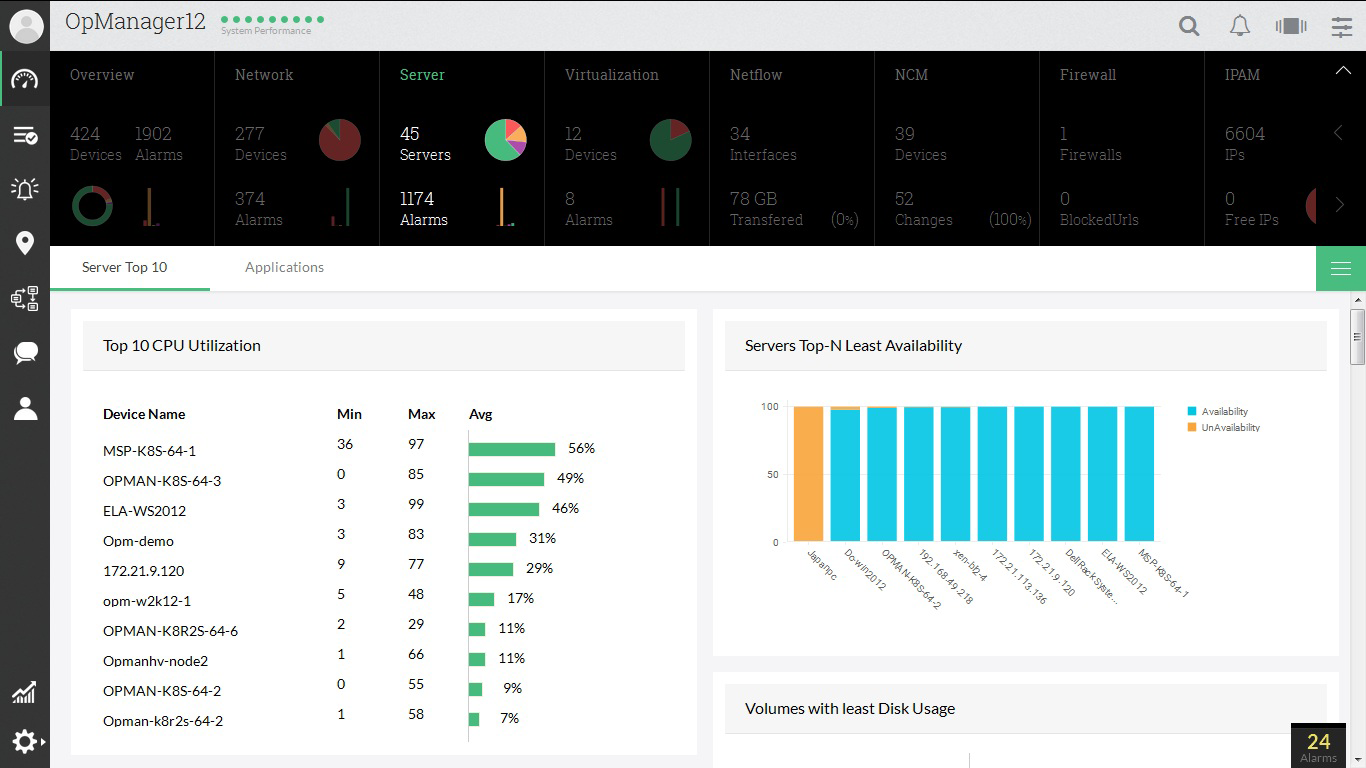
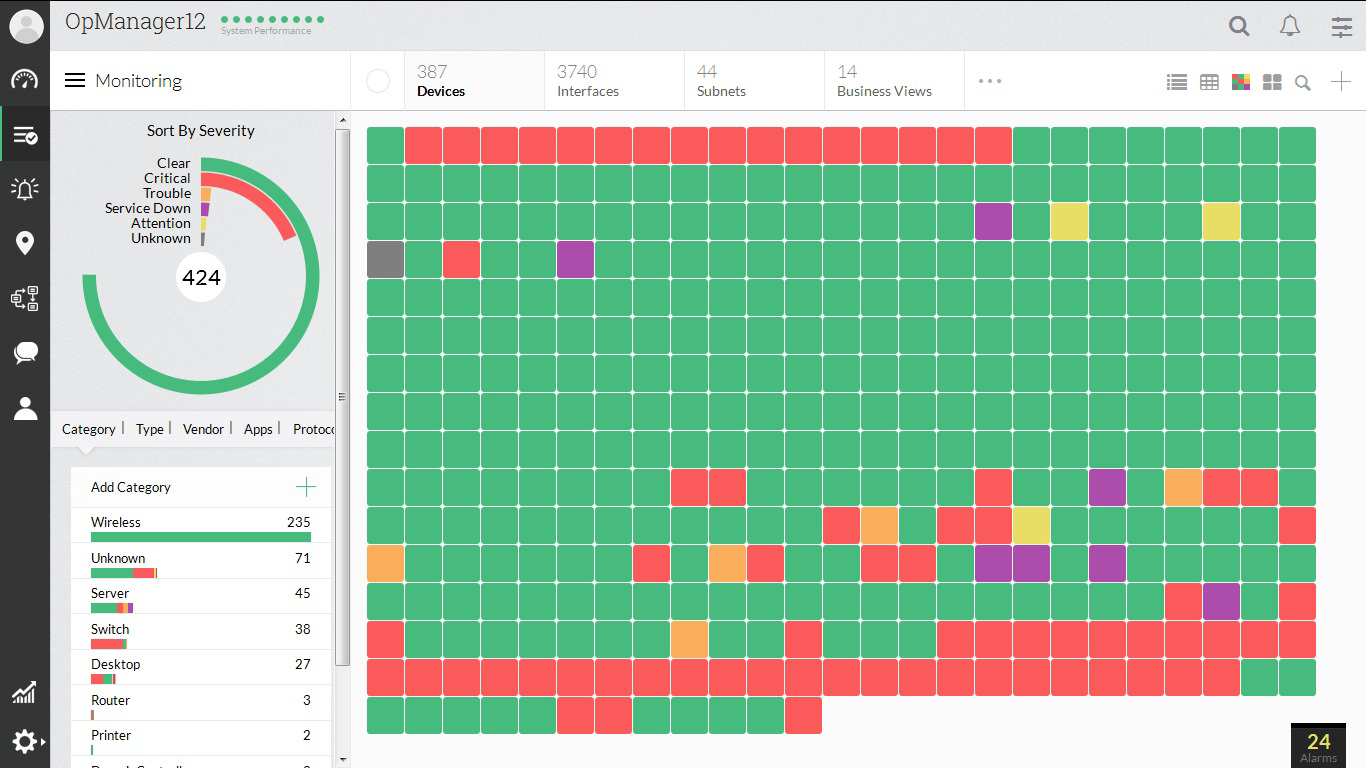
Ever wonder if it's possible to have a bird's-eye view ofvery large networks with over 50,000 devices? It's possible now using our HeatMap view. By the way, our Large Enterprise Edition can monitor up to 50,000 devices or 1 million interfaces.
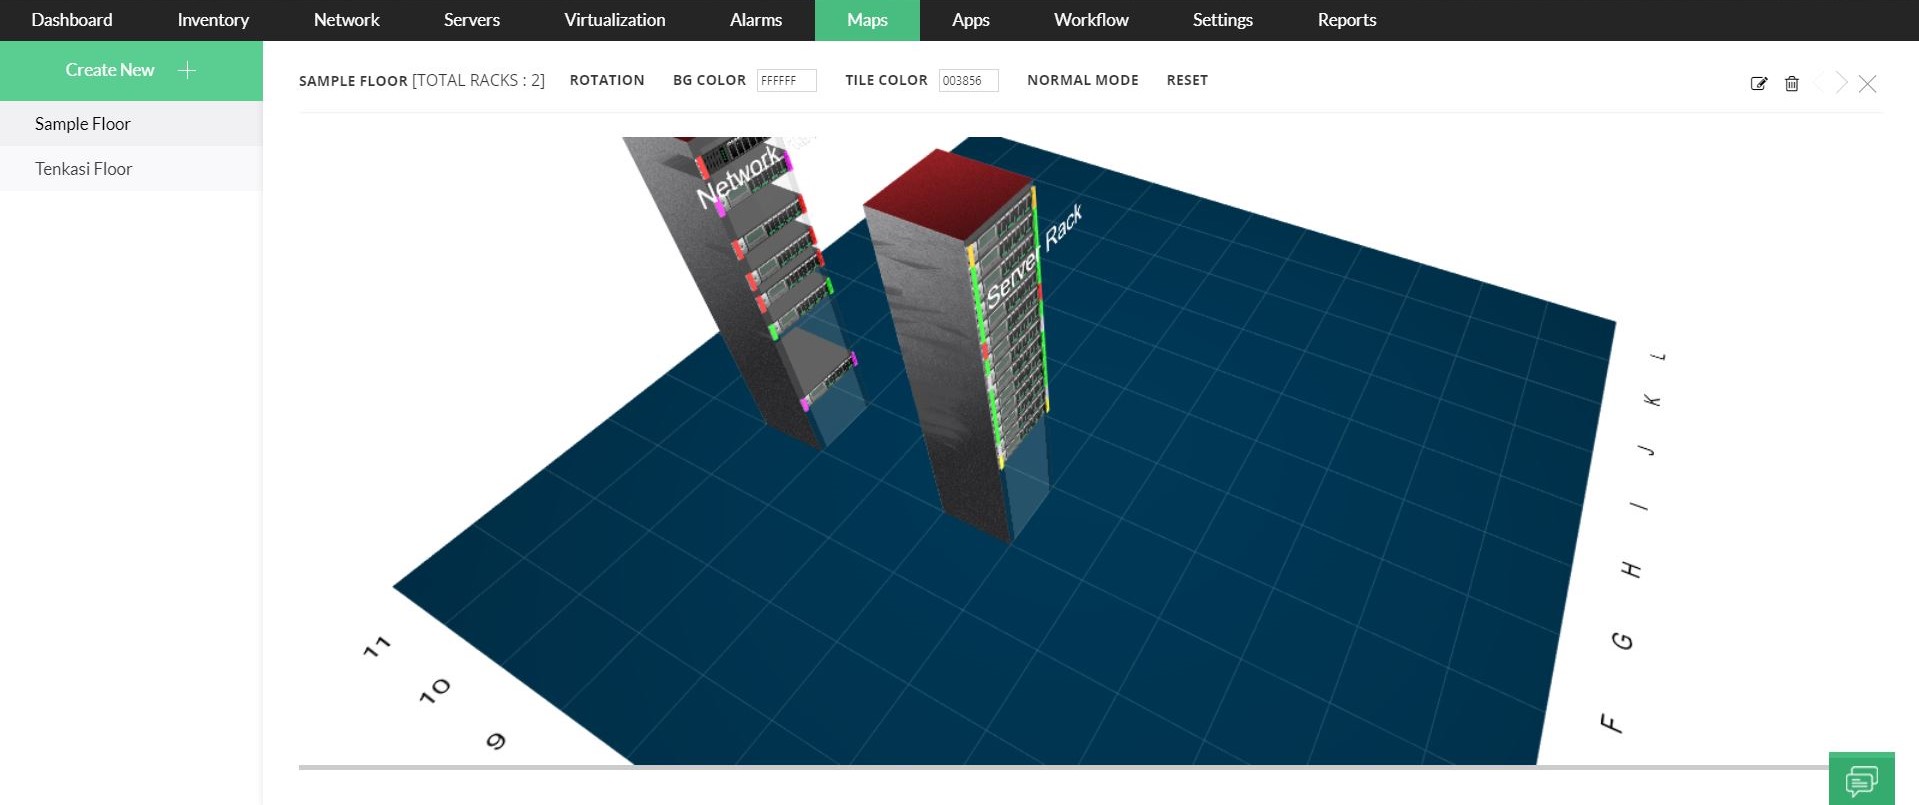
Or you can create your own floors and racks as they are in the data center and view the status of those devices using our 3D data center option.
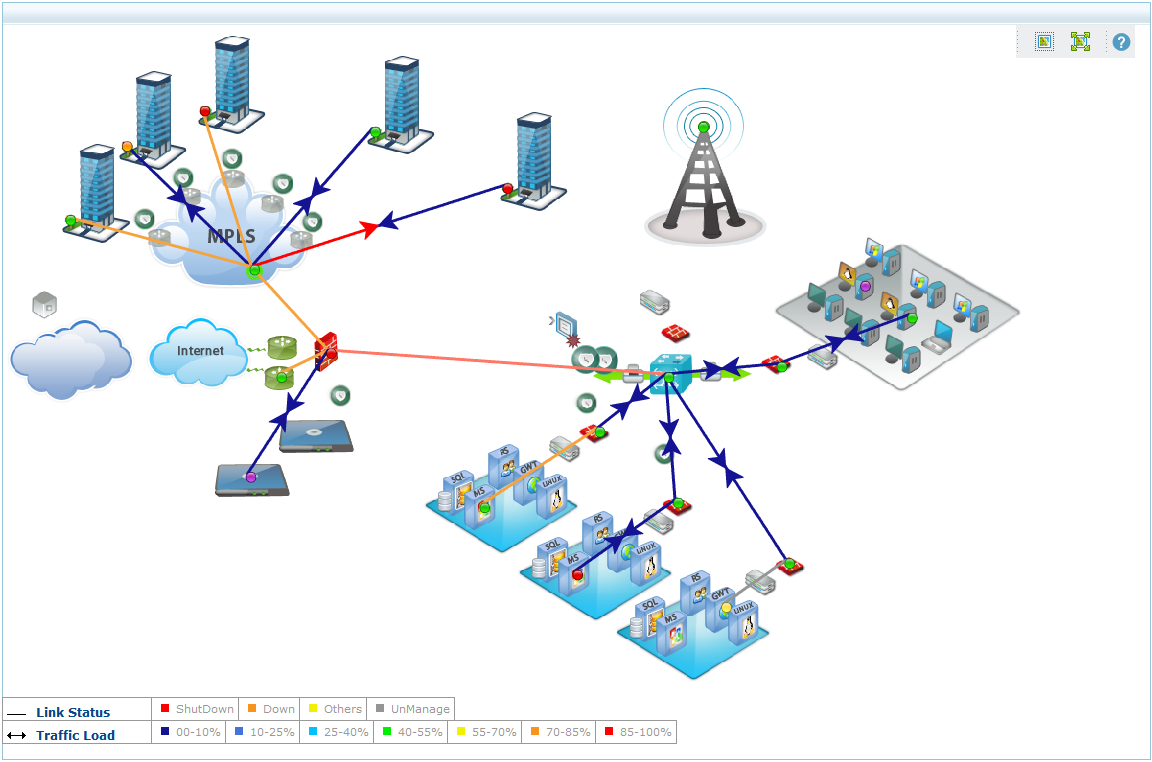
If you just want to view a group of devices and the links between them, you can group them in our business view and visualize them.
Understanding the importance of reports, we have over 125 out-of-box reports, which have met the needs of our most customers.
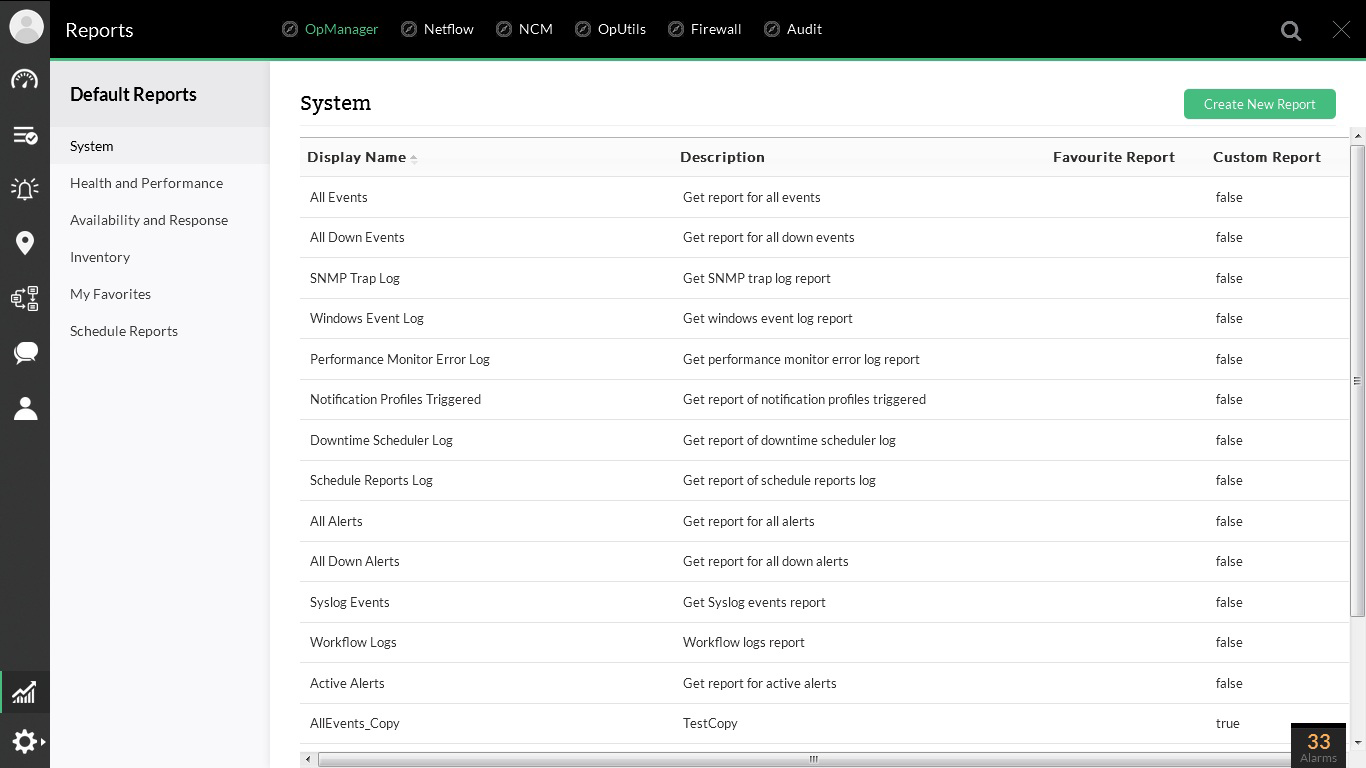
For the remaining customers, we have a report builder to helps customize reports on an as-needed basis.
You can also export these reports as widgets and use them on your dashboard.